


How Are Home Values Doing in Our Area, and Why?
Prices are lower than a year ago, inventory is higher and fewer homes are selling. Here is the data, with dates, and what it means if you are thinking about selling.
As of November 9, 2026: this post uses NWMLS data compiled by InfoSparks (ShowingTime) for median prices, NWMLS monthly reports for August and October 2026, Freddie Mac mortgage rates through November 5, 2026 and NAR data for the third quarter of 2026. Market numbers change often, so contact us for current figures.
This is a very time-sensitive post. While many of the topics here are not specific to the current market, the details are very time-centric and need to be re-analyzed regularly. We highly encourage you to contact us for current market information.
The short answer
Prices in King County are lower than a year ago (down 3.7 percent for houses and 15.9 percent for condos in October), inventory is higher, and fewer homes are selling. National prices have been slightly higher. Here is the data, with dates.
King County
| Measure | August 2026 | October 2026 |
|---|---|---|
| Median sales price | Houses $925,000 (down 5.1% from August 2025) Condos $509,000 (down 7.5%) | Houses $938,863 (down 3.7% from October 2025) Condos $470,700 (down 15.9%) |
| Active listings | 7,703 (up 30.0% from a year earlier) | 7,592 (up 32.8%) |
| Closed sales | 1,791 (down 13.6%) | 1,756 (down 18.1%) |
| Pending sales | 2,101 (down 8.4%) | 1,831 (down 17.8%) |
| Months of inventory | 4.30 | 4.32 |
The ten-year view
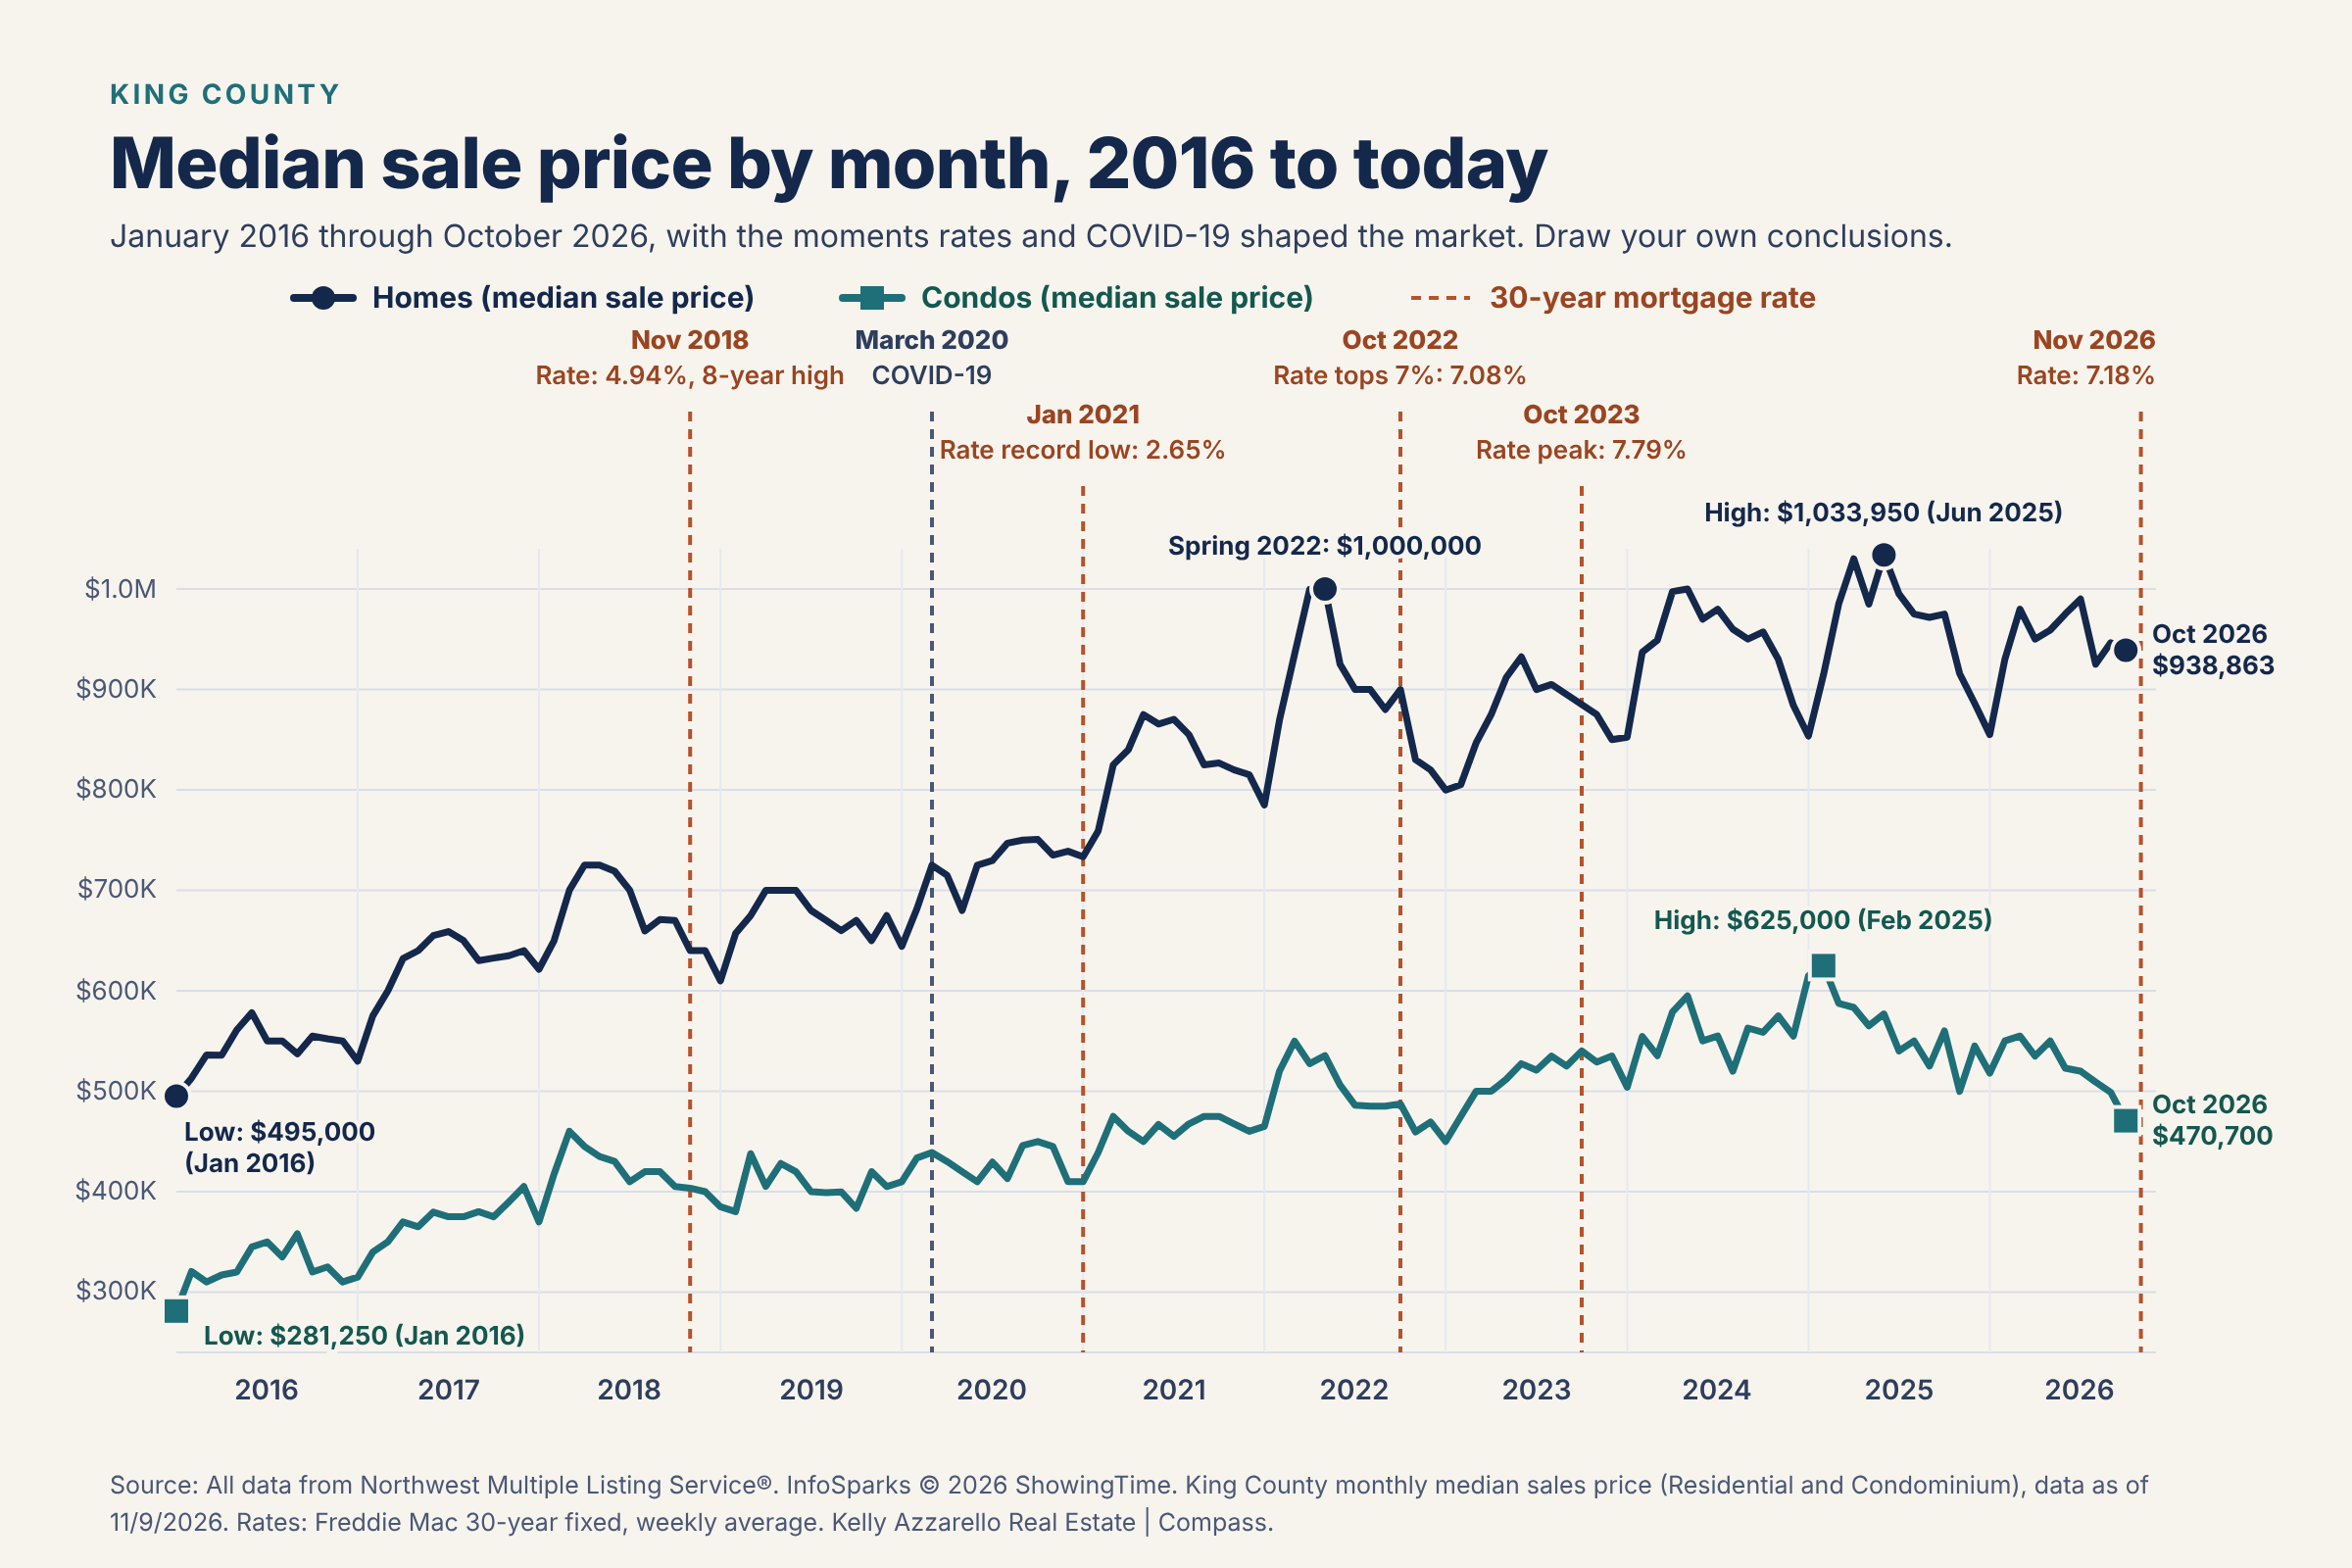
Using Northwest Multiple Listing Service data compiled by InfoSparks (ShowingTime), the King County median sale price for houses peaked at $1,033,950 in June 2025 and was $938,863 in October 2026. For condominiums, the peak was $625,000 in February 2025 and the October 2026 median was $470,700. The lows in this ten-year period were $495,000 for houses and $281,250 for condominiums, both in January 2016.
Source: Northwest Multiple Listing Service, InfoSparks © 2026 ShowingTime, data as of November 9, 2026. Mortgage rates: Freddie Mac.
The Eastside
- In the October 2026 NWMLS report, the Eastside median price for single-family homes was $1.35 million, down 12.9 percent from a year earlier (June 2026: almost $1.6 million, down 3.1 percent).
- In October, the most expensive Eastside submarket, Bellevue west of Interstate 405, had a median of a little more than $3.4 million, up 5.4 percent on only 16 sales (in June it was almost $3.7 million, down 19.8 percent). Small, high-priced markets swing a lot from month to month. Median prices in this area are normally skewed high because of the number of very expensive properties.
- King County's median for houses was $938,863 in October 2026, down 3.7 percent from $975,000 in October 2025, and $925,000 in August 2026, down 5.1 percent from $975,000 in August 2025 (NWMLS data compiled by InfoSparks). King County condos had a median of $470,700 in October 2026, down 15.9 percent from $560,000, and $509,000 in August 2026, down 7.5 percent from $550,000 (InfoSparks). The NWMLS October recap showed about 7.0 months of inventory for condos.
How this compares with the country
NAR reported that the national median existing single-family price was $432,900 in the third quarter of 2026, up 1.7 percent from a year earlier. Our area is running below that trend.
Why it is happening
- Affordability. The Washington Center for Real Estate Research said in the NWMLS October report that interest rates rose even further, with 30-year mortgage rates averaging 7.33 percent in October versus 6.86 percent in September. Rates were 5.98 percent at the end of February 2026, the lowest since September 2022, but they have since risen. Freddie Mac's weekly 30-year fixed average was 7.18 percent on November 5, 2026, its third straight weekly decline from 7.40 percent on October 8 and October 15. That is still up from 6.95 percent on September 17, 6.65 percent on August 20 and 6.22 percent a year earlier.
- More supply. King County had 7,592 active listings at the end of October, up 32.8 percent from a year earlier, which gives buyers more choices and more time to decide.
- Slower sales. In October, King County closed sales were down 18.1 percent and pending sales were down 17.8 percent from a year earlier, which points to cooler demand.
What it means for you
Averages hide a lot. A well-prepared, well-priced home in a strong location can still do well, while a home that is overpriced or in need of work sits. If you are thinking about selling, the useful number is not the county median. It is what comparable homes near you have sold for recently.
City-level numbers
We will cover city specific data in a later post. Stay tuned!
From Our Own Experience
Over the last few years, prices in our market have pulled back. This is somewhat expected, because prices rose so quickly in the early 2020s in response to demand during COVID.
Homes that are priced well continue to sell well. Homes priced on the values of previous years (aspirational pricing) tend to sit longer and often need multiple price reductions before they move.
Buyers have also changed how they behave. They are negotiating harder, which we have not seen in several years, since the market here moved up quickly in the late 2010s. Recent requests include:
- Price adjustments or money back at closing based on inspection results
- Offers far below the listing price
- Seller money applied to interest rate buydowns or closing costs
Many of these requests, especially the inspection requests, are considered “unreasonable” by the other party. Even so, fewer sellers have walked away from deals because of them.
Thinking about selling in the Seattle Area?
Kelly Azzarello Real Estate | Compass
Email: kelly@kellyazzarello.com
Phone: (425) 830-6457
Web: www.kellyazzarello.com
Instagram: instagram.com/kellyazzarello
YouTube: youtube.com/kellyazzarellorealestate
This post is general information about real estate topics. It is not legal, tax or financial advice, and it does not replace a professional inspection. Rules and practices differ by situation and change over time. Check current requirements and talk with a licensed professional, such as an inspector, contractor, attorney or CPA, about your own property.
Sources
- InfoSparks (ShowingTime), Northwest Multiple Listing Service King County monthly median sales price, Residential and Condominium, data as of November 9, 2026
- NWMLS Recaps, October 2026: nwmls.com/wp-content/uploads/2026/11/Recaps-October2026.pdf
- NWMLS Recaps, August 2026: nwmls.com/wp-content/uploads/2026/09/Recaps-August2026.pdf
- NWMLS Market Snapshot, October 2026 (published November 5, 2026): nwmls.com/market-snapshot-october-2026/
- MyNorthwest coverage of the June 2026 NWMLS report (June Eastside figures): mynorthwest.com/lifestyle/425/real-estate-report-inventory-expanding-sales-prices-lower/4254808
- 425 Business, NWMLS October 2026 report (Eastside figures, mortgage rate comments): 425business.com/news/northwest-multiple-listing-service-october-2026-report/article_61c26012-cee7-4bba-bdd1-df6ce5f0790d.html
- NAR, Home Prices Rise in 78% of Metro Areas in Q3 2026 (October 29, 2026): nar.realtor/newsroom/home-prices-rise-78-percent-metro-areas-q3-2026
- Freddie Mac Primary Mortgage Market Survey, rates through November 5, 2026: freddiemac.com/pmms

When Should I Sell My Home?
Is there a best month to sell your home? Here is King County data by month for 2025 and 2026, and the questions that matter more than the calendar.
There are two questions here: Make certain you understand which is being asked.
- The first question is whether you should sell your home. This is a very personal decision and is something you will likely think about over a long period of time. While significant changes in your life (job transfers, family issues or needs, aging) may happen, most of our clients have been considering selling their home for a significant amount of time.
- The second question is the one we’ll address in detail below: “What month or time of year should I sell my home?” There is historical data to support certain months being better for selling (improved sale price, fewer days on market, etc.). There are also times when putting your home on the market is NOT going to provide an optimal result because fewer people are looking for homes.
There is no single best month
People often ask when the market peaks. The better question is when selling works for your life, your finances and your home, and whether the market gives you a fair shot at the price you need. Three groups of factors decide that.
What the data says about timing
Here is what happened month by month in King County, based on Northwest MLS (NWMLS) data for houses and condominiums combined. New listings are homes that came on the market during the month. Pending sales are homes that went under contract. Closed sales are homes that finished the sale. The first three columns are 2025, a full year. The next three are 2026 so far.
Note on the last column: it is the median days on market for King County, from NWMLS data compiled by InfoSparks (ShowingTime), data as of November 9, 2026. The median is the middle home: half were faster and half took longer, so a few very slow homes do not skew it.
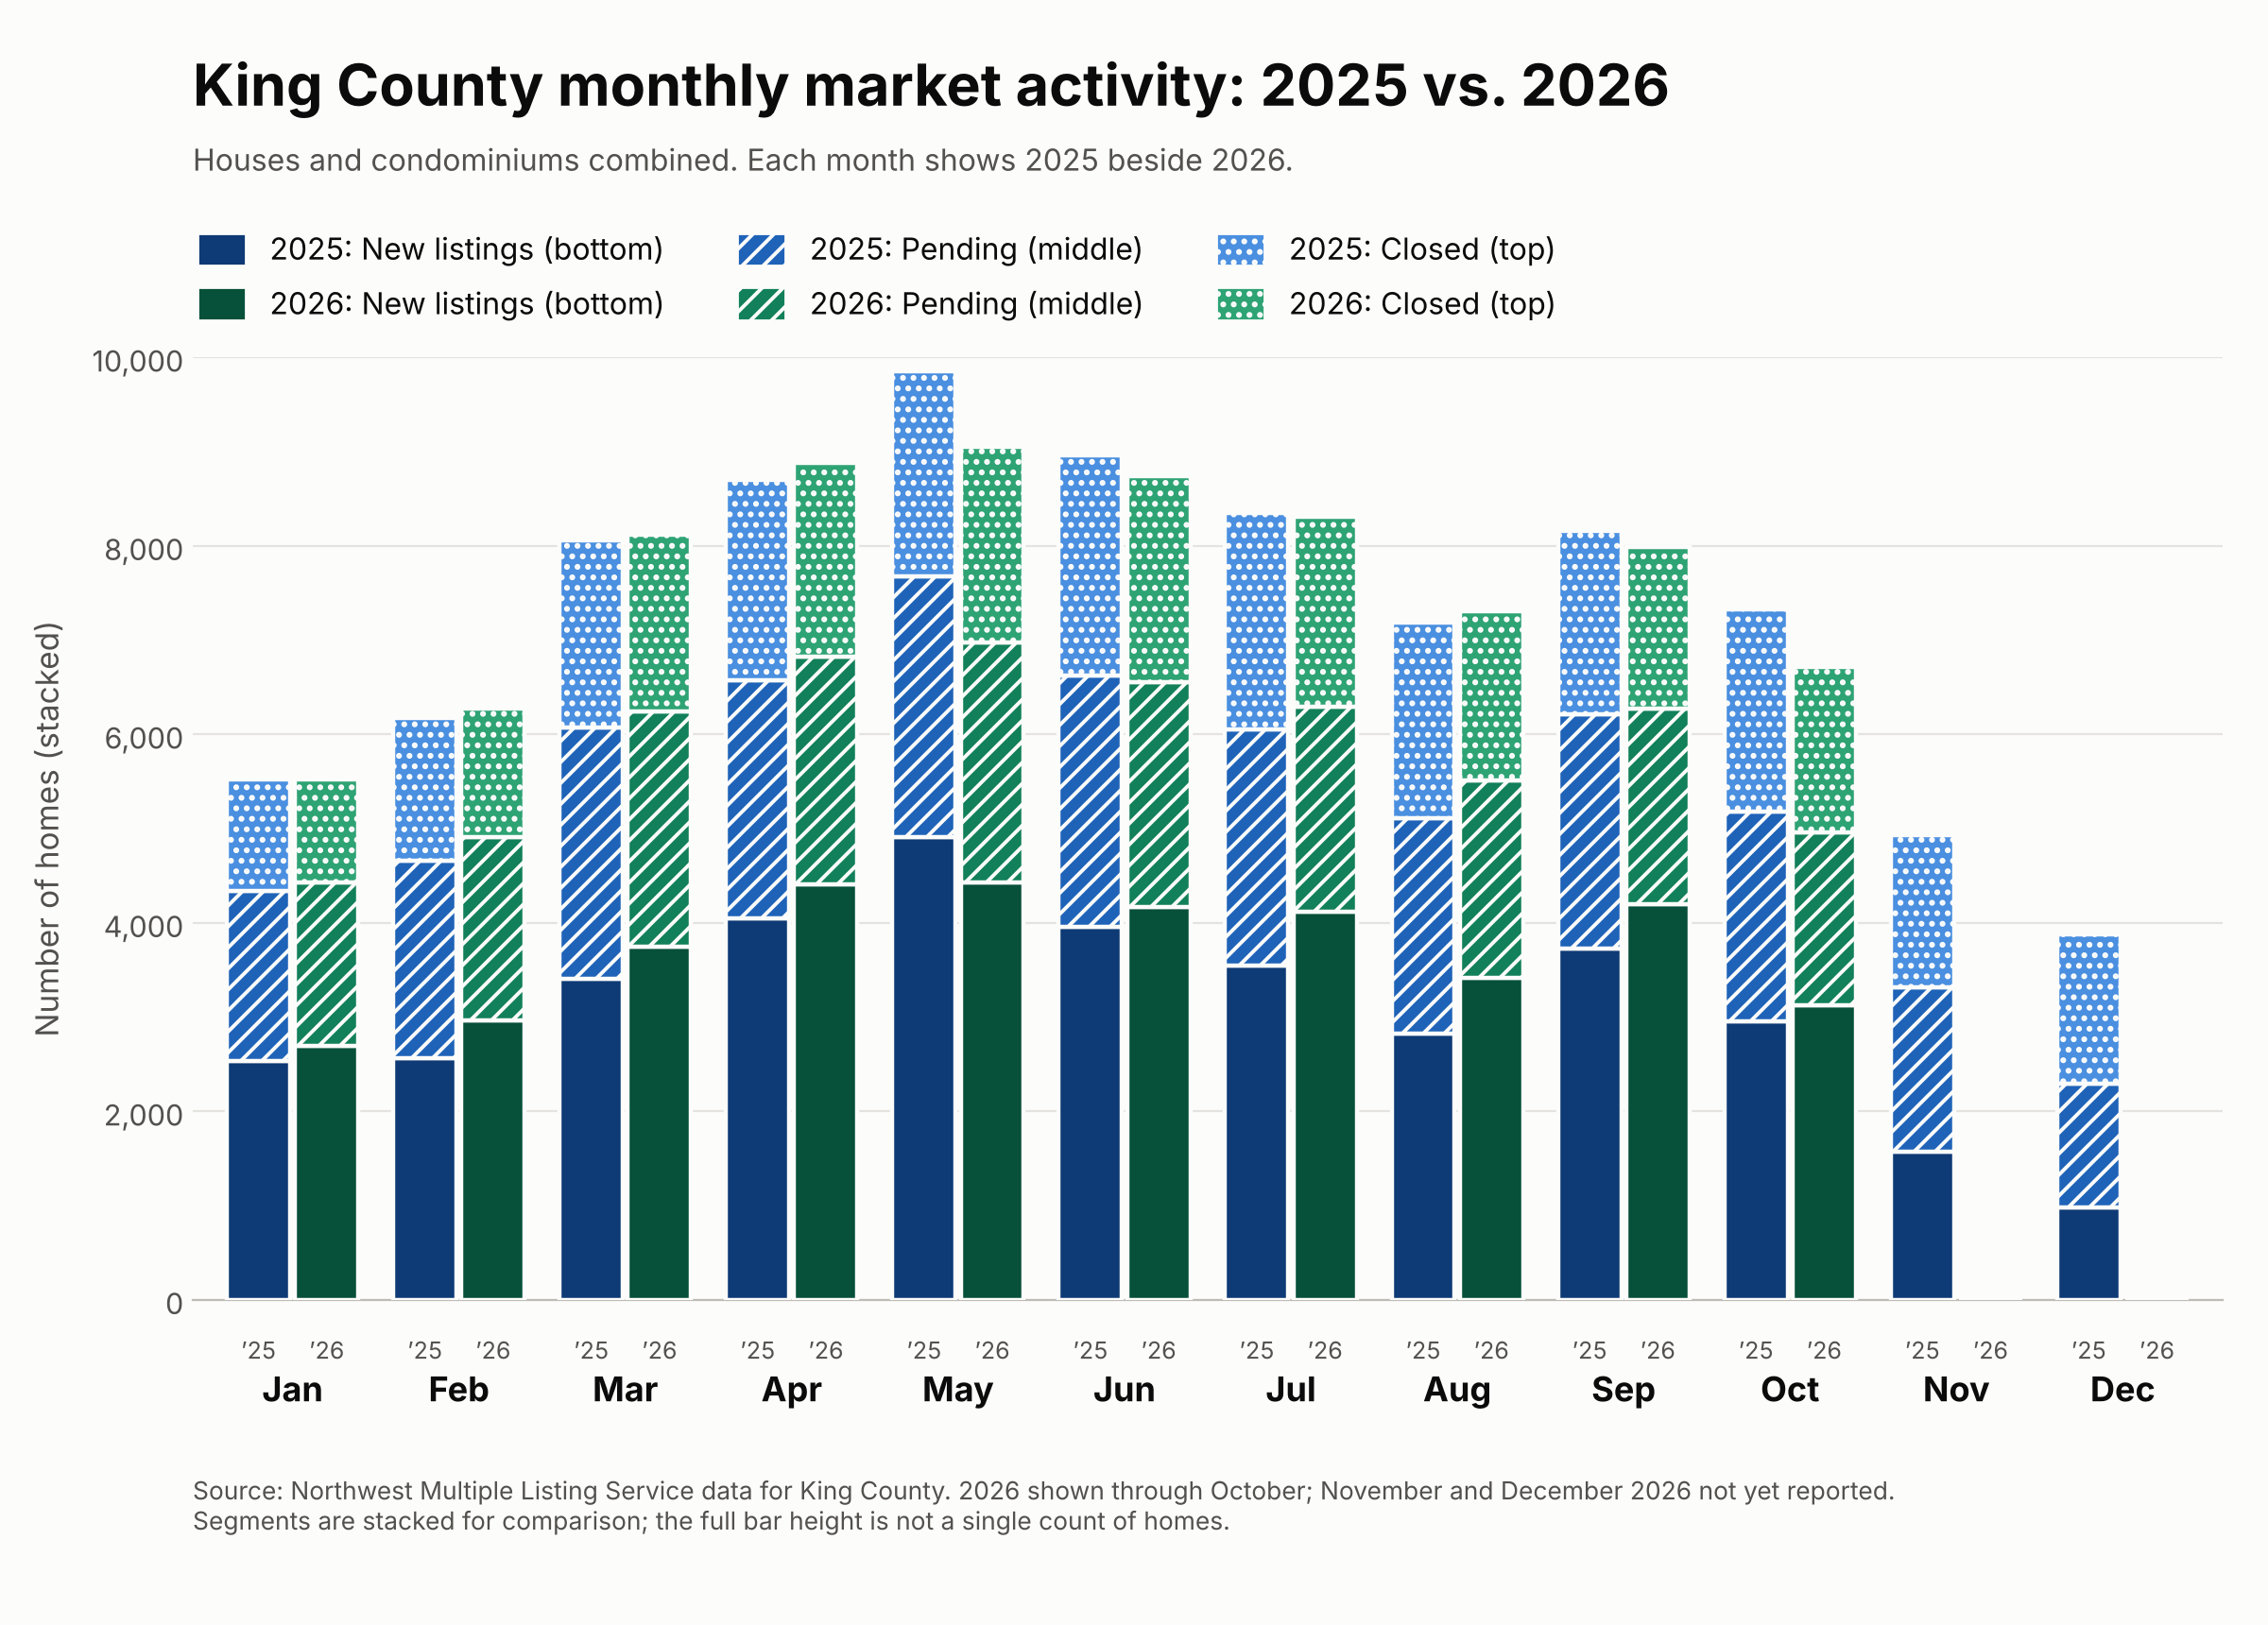
King County, houses and condominiums combined, by month
| Month | New listings 2025 | Pending 2025 | Closed 2025 | New listings 2026 | Pending 2026 | Closed 2026 | Median days on market (2025 / 2026) |
|---|---|---|---|---|---|---|---|
| January | 2,533 | 1,810 | 1,181 | 2,694 | 1,735 | 1,099 | 31 / 42 |
| February | 2,571 | 2,087 | 1,516 | 2,968 | 1,945 | 1,364 | 9 / 16 |
| March | 3,408 | 2,662 | 1,991 | 3,750 | 2,493 | 1,878 | 7 / 10 |
| April | 4,052 | 2,524 | 2,127 | 4,414 | 2,416 | 2,053 | 6 / 10 |
| May | 4,909 | 2,768 | 2,180 | 4,429 | 2,549 | 2,074 | 7 / 10 |
| June | 3,960 | 2,668 | 2,332 | 4,165 | 2,390 | 2,183 | 10 / 13 |
| July | 3,552 | 2,506 | 2,296 | 4,124 | 2,168 | 2,022 | 13 / 15 |
| August | 2,822 | 2,294 | 2,073 | 3,416 | 2,101 | 1,791 | 18 / 20 |
| September | 3,725 | 2,487 | 1,952 | 4,204 | 2,072 | 1,714 | 21 / 22 |
| October | 2,953 | 2,228 | 2,144 | 3,132 | 1,831 | 1,756 | 18 / 18 |
| November | 1,573 | 1,742 | 1,613 | not yet | not yet | not yet | 22 / not yet |
| December | 987 | 1,310 | 1,582 | not yet | not yet | not yet | 31 / not yet |
| January to October total | 34,485 | 24,034 | 19,792 | 37,296 | 21,700 | 17,934 | — |
| 2025 full year total | 37,045 | 27,086 | 22,987 |
What to notice
- Spring is the busiest season on both sides. In 2025, new listings peaked in May (4,909) and pending sales peaked in May (2,768). Closed sales peaked in June (2,332), after contracts written in the spring.
- Winter has far fewer listings, but buyers do not disappear. In November 2025, 1,573 homes were listed and 1,742 went under contract. In December, 987 were listed and 1,310 went under contract. In May, by comparison, 4,909 were listed and 2,768 went under contract. Fewer competing listings does not automatically mean a better price, so the count of listings is only one input.
- So far in 2026 the pattern is different. In every month from January through October, fewer homes went under contract and fewer closed than in the same month of 2025, while new listings were higher in nine of the ten months (May was lower). For January through October combined, new listings were up about 8 percent, pending sales were down about 10 percent and closed sales were down about 9 percent (calculated from the table).
- Homes took longer to sell in 2026. The median days on market was higher than in the same month of 2025 in every month through September, and equal in October (18 days). For example, April was 10 days versus 6, June was 13 versus 10 and August was 20 versus 18. The seasonal pattern shows in both years: the median was shortest in spring (6 to 10 days from March through May) and longest in winter (31 days in December 2025 and 42 in January 2026).
- The data does not point to a single best month. Early in the year provides sellers with less competition as there are few listings and many buyers start their search in the beginning of the year. Spring has the most buyers and the most competing listings. Late fall and winter have fewer of both. Which tradeoff favors you depends on your home, your price and your timeline.
Sources: NWMLS 2025 Annual Statistical Review and Highlights, King County (nwmls.com/wp-content/uploads/2026/01/King-AnnualReview2025.pdf); NWMLS monthly recaps and King County breakouts, January to October 2026 (nwmls.com); InfoSparks (ShowingTime), NWMLS median days on market, King County, data as of November 9, 2026. 2026 figures run through October. November and December 2026 are not yet available.
Some guidelines that will help you make better decisions
Your life
- A job change, retirement, a growing or shrinking household, or a health or care need often sets the date for you.
- Where you will live next, and how long you will need to move, matters as much as the sale itself.
- If you need the proceeds to buy your next home, build in time for both transactions.
Your finances
- Equity. After a sale you pay off your mortgage and selling costs. Ask for a net sheet that shows what you would actually take home.
- Taxes. Generally, if you have owned and lived in the home for a total of 24 months in the five years before the sale, you can exclude up to $250,000 of profit, or $500,000 if married filing jointly. Rules have conditions, so check with a CPA. For the details, see IRS Publication 523.
- Carrying costs. Every month you wait has mortgage, tax, insurance and upkeep costs.
The market
- Inventory and pace. More homes for sale and slower sales give buyers more leverage. See our post, How Are Home Values Doing in Our Area, and Why?, for current numbers.
- Interest rates. Rates affect what buyers can pay. Waiting for a better rate is a bet, not a plan.
- Season. Spring is typically busy, but a well-prepared and well-priced home can sell at other times, and there may be fewer competing listings in off-peak months.
Your home
- A major repair coming up, such as a roof, sewer line or crawl space problem, is better handled before listing than discovered by a buyer.
- If you are not ready to prepare the home, waiting a few months to do it right can pay for itself.
A simple timing check
Ask yourself: When do I need to be out? How long will preparation take? What do I need to net? What are comparable homes doing right now? A walk-through with an agent turns those questions into a plan.
Related reading: What Is My Home Worth, and How Is the Listing Price Set? | I Found a Home I Love for Retirement, but I Don't Know if Mine Will Sell
From Our Own Experience
Trying to time the real estate market is like trying to time the stock market: You’ll never get it exactly right. However, there are times when there are advantages to selling your home. We have had good success with clients who can sell their homes in the early part of the calendar year. We believe that this is due to the following:
- Pent up buyer demand that releases in the new year (after the holidays)
- Buyers who have goals to buy in the new year
- Buyers who wish to take advantage of the fiscal, investment or tax benefits of owning a home (holiday gatherings and discussions often focus on these; parents often being key in these discussions)
While seller-centric, we have also encountered sellers who want to have “one last holiday” in their home before putting it on the market.
Thinking about selling in the Seattle Area?
Kelly Azzarello Real Estate | Compass
Email: kelly@kellyazzarello.com
Phone: (425) 830-6457
Web: www.kellyazzarello.com
Instagram: instagram.com/kellyazzarello
YouTube: youtube.com/kellyazzarellorealestate
This post is general information about real estate topics. It is not legal, tax or financial advice, and it does not replace a professional inspection. Rules and practices differ by situation and change over time. Check current requirements and talk with a licensed professional, such as an inspector, contractor, attorney or CPA, about your own property.
Tax: Tax treatment depends on your individual circumstances and changes over time. Consult a CPA or tax professional about your situation.